to the personal website of Thomas J. Morahan, an internationally recognized earth scientist, business entrepreneur, musician and cook.
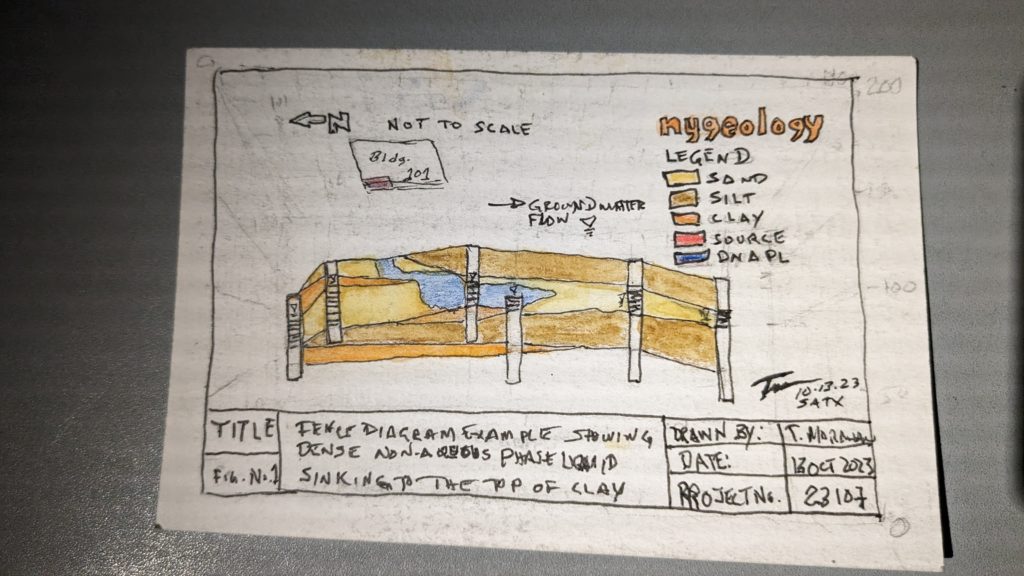
The postcard below is an example that was created to demonstrate how to manually draw geological fence diagrams by hand, a skill that comes in handy when explaining subsurface to non technical folks such as attorneys, business clients or jurists. It was drawn with Faber-Castell Watercolor Pencils during a turbulent flight in a cramped middle seat in the back of a plane from Newark to San Antonio. Here’s how its done:

Steps: 1.) Decide on the scale of the final drawing and set up the perspective box so it will fit on the final drawing – first, the front and back of the box is appropriately scaled to reflect the x-axis on the top edges and the z-axis (depth) along the side edges. Then the y-axis trends from the front of the box to the smaller rear which is further away, forming the top of the box. This allows for a 3D look down inside so as not to obscure the borehole data further away from the borehole data in the front. 2.) Transfer the x-y data for the top of each borehole to the top surface of the box. Drop a vertical line for each borehole and show the borehole number. 3.) Determine the elevation of each borehole consistent with the varies z scale the represents the depth perspective and mark the top of each borehole. 4. Transfer the geologic data from the strip log for each borehole into the respective vertical lines using the appropriate value for z because depths will appear to be different depending on how close the borehole is to the viewer. 6. Erase the pencil guidelines in the center of the box that were used to set it up. 5.) Connect similar lithology (i.e. sand, silt, clay) remember that several distinct zones of the same material may be present and that some zones can “pinch out.” 6.) Present the beds in logical geological colors. 7.) Add any other items of interest such as water level and groundwater flow. In this case, the Dense Non-aqueous Phase Liquid contamination that is sinking through the water to the top of the clay is also shown. 8.) Create the legend showing the geological units (and don’t forget the north arrow.) 9.) Transfer the drawing to engineering paper, remembering to also label the x, y, and z axis scales. 10.) Label the drawing: Figure No. (if applicable) Title, Date, Drawn by, Checked by, Company Information, Project No. etc. and add a logo.
That’s how it was done before computers. Try it sometime, but be forewarned: this exceedingly simple and technically easy drawing took over three hours to complete.
The ability to manually construct fence diagrams is a valuable skill to develop because it helps you think in three dimensions. Further, it helps you explain to ordinary lay people with no scientific training the geological, hydrogeological and chemical systems that are invisible to the naked eye.